THE OFFLINEATLAS R PACKAGE
This package helps you to create interactive dynamic maps in R as well as static visualizations for papers, publications, or presentations.
You can explore variables across countries, follow change over time, or connect places and people, and the objects you create do not have to be geospatial. The package allows allows you to create editable static figures using ggplot2 from the same atlas.
Install and make your first atlas
install.packages("remotes")
remotes::install_github("preblek/offlineatlas")
library(offlineatlas)
R 4.1 or later is required. Missing required R packages are installed automatically. Systems that compile sf from source may need additional system libraries.
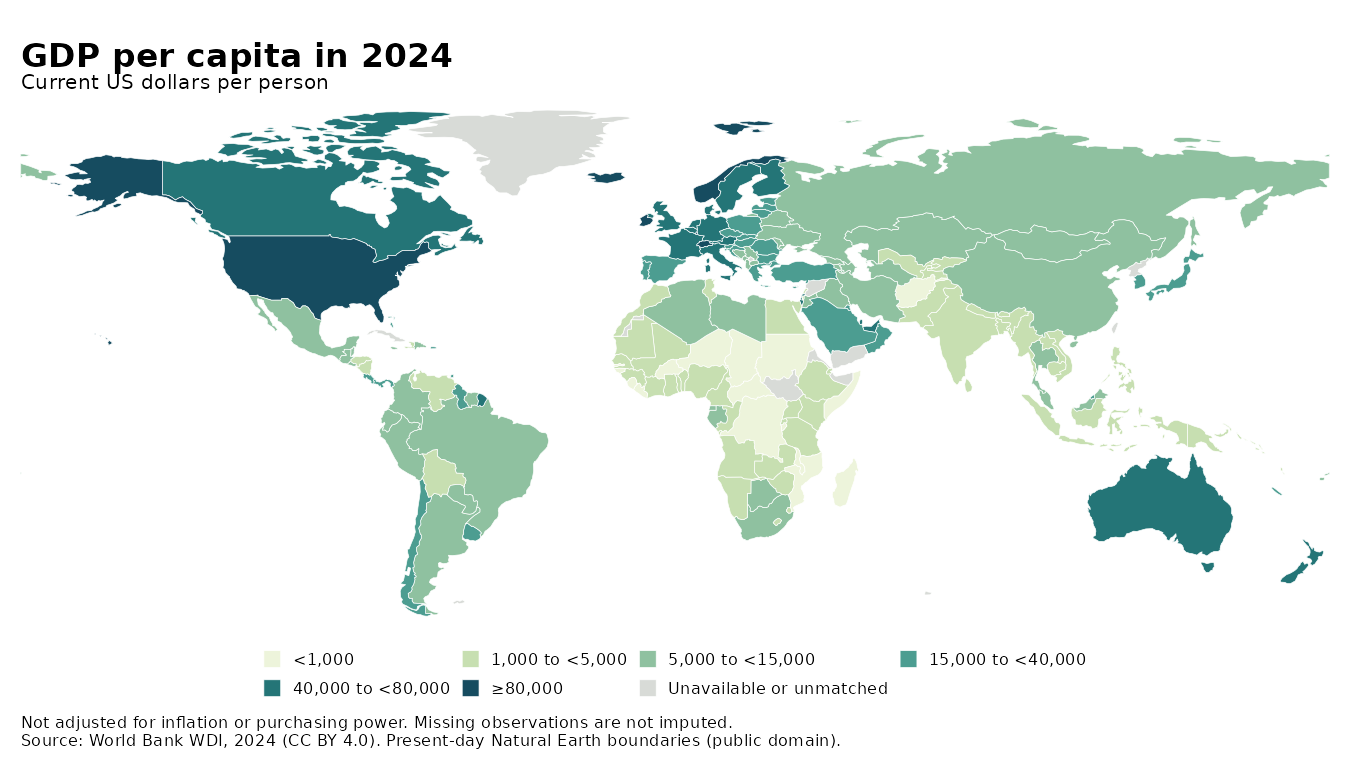
The getting-started tutorial walks through a map of variation in gross domestic product (GDP), the Florence family network commonly used in social network courses and workshops, and an FDI timeline. The getting started tutorial also walks you through customization and how to create static figures. There is also a demo gallery that pairs working examples with their R scripts.
From R to a file you can share
- Build an atlas from data frames or sf boundaries. Add variables, relationships, or time periods.
- Customize legends, controls, labels, and presentation through R functions.
-
Export a standalone HTML file with
export_html(), or an editable ggplot2 figure withas_ggplot().
The HTML includes its data, geometry, JavaScript, CSS, and artwork all in one HTML file. Viewers do not require an R installation, Shiny server, API key, or online map tiles to view and interact with the files. Depending on the size of the HTML file, you can email the file, open it locally, or place it on a static website such as GitHub Pages or Dropbox, for example. Take note that the data can be read by anyone who receives the file, so export only data you intend to share (although there are ways to secure data if you plan to place the html file online).
Choose an example
- Maps of variables · GDP, regional sf boundaries, and national FDI inflows.
- Change over time · EU enlargement waves and FDI timelines.
- Networks · Florence family ties, fictional aid, and bilateral FDI.
- Static figures · ggplot2 maps and networks, automatic layouts, and node styling.
Related preprint
For more on using portable interactive atlases in political science research, see Keith A. Preble’s Portable Interactive Atlases for Political Science Research on APSA Preprints. The paper illustrates the approach with international trade and economic sanctions and includes interactive examples, as well.
A living example
FDI Atlas is a related, more customized web project showing how this approach can be used for a public-facing atlas hosted on my web site. The package examples presented on this site generates standalone files. Their source and data notices travel with each exported viewer. The bilateral FDI data for FDI Atlas was provided by UNCTAD.
offlineatlas is an early release. Report a problem or suggest an improvement.