Explore an example, download its standalone HTML, or use its R script as a starting point for your own data. Every live demo below runs entirely in your browser. Downloaded HTML files work without R, a server, or an internet connection.
The images are static ggplot2 previews. Interactive viewers have their own controls and presentation. On a small screen, opening the demo directly gives it more room than an embedded frame.
Maps and change over time
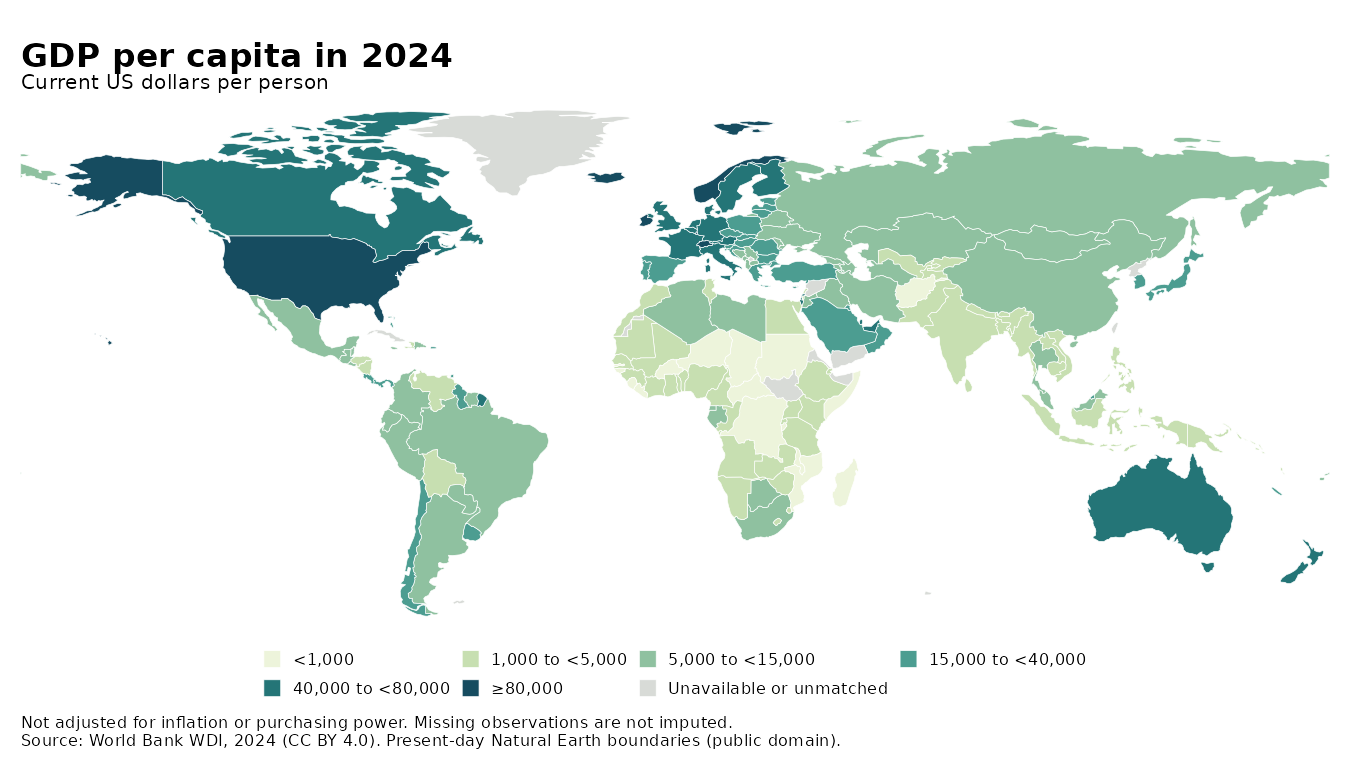
World Bank GDP
Compare GDP per capita and total GDP across countries. Select a country to inspect its values.
World Bank WDI, 2024, CC BY 4.0. Current US dollars, not purchasing-power-adjusted. Natural Earth boundaries are public domain.
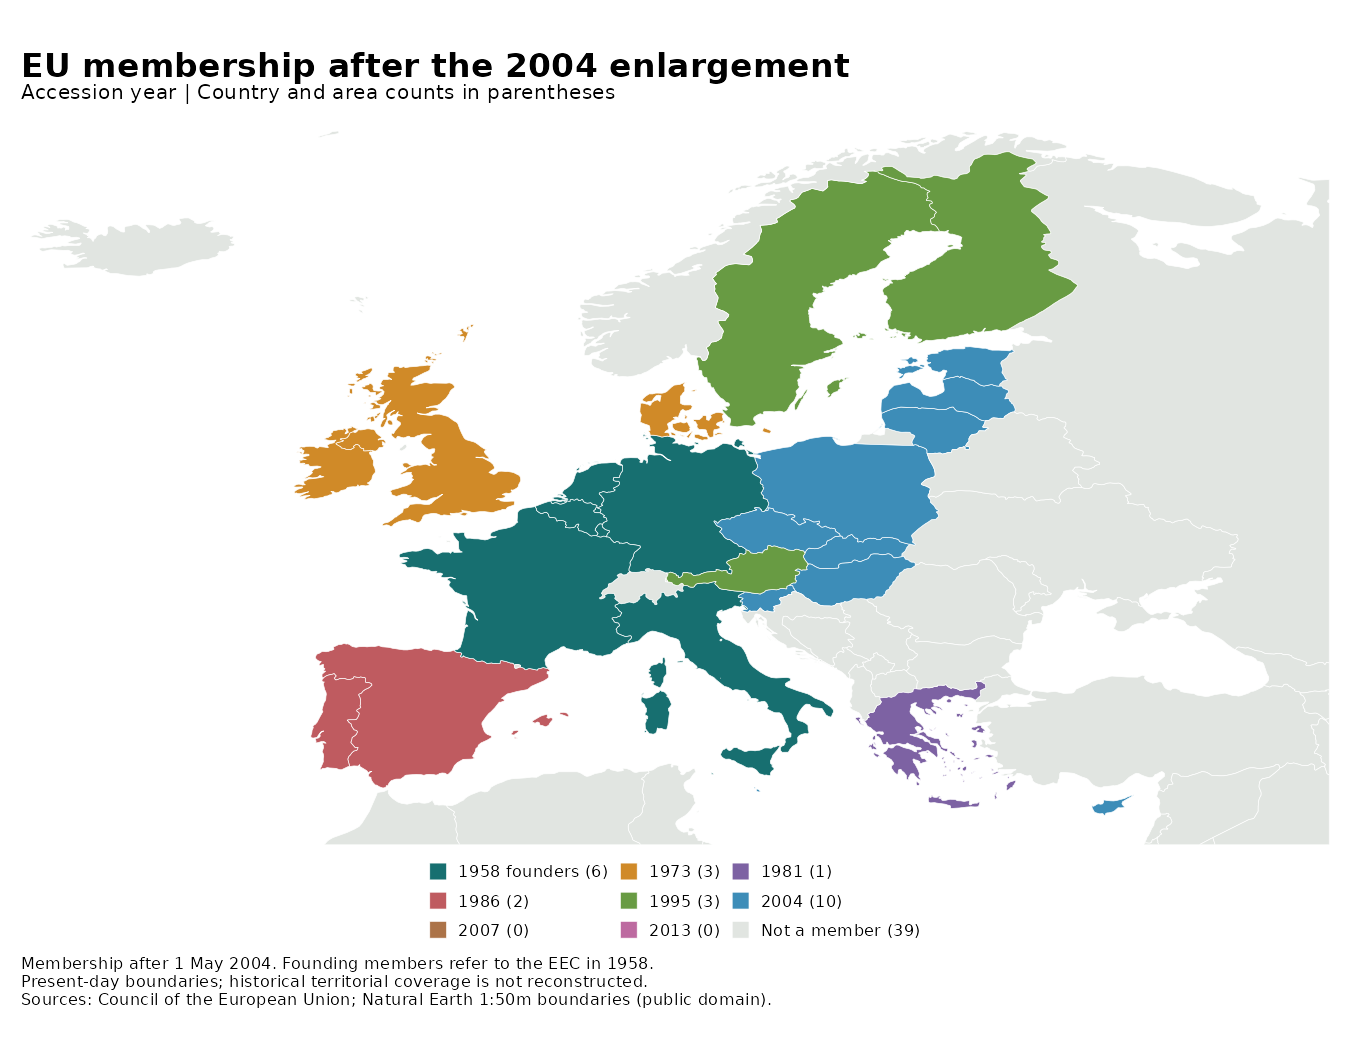
EU enlargement
Move through enlargement periods from the 1958 EEC founders to the UK’s departure in 2020. Colors identify accession waves.
Council of the European Union membership history. Present-day Natural Earth boundaries; historical territorial coverage is not reconstructed. Preview shows 2004.
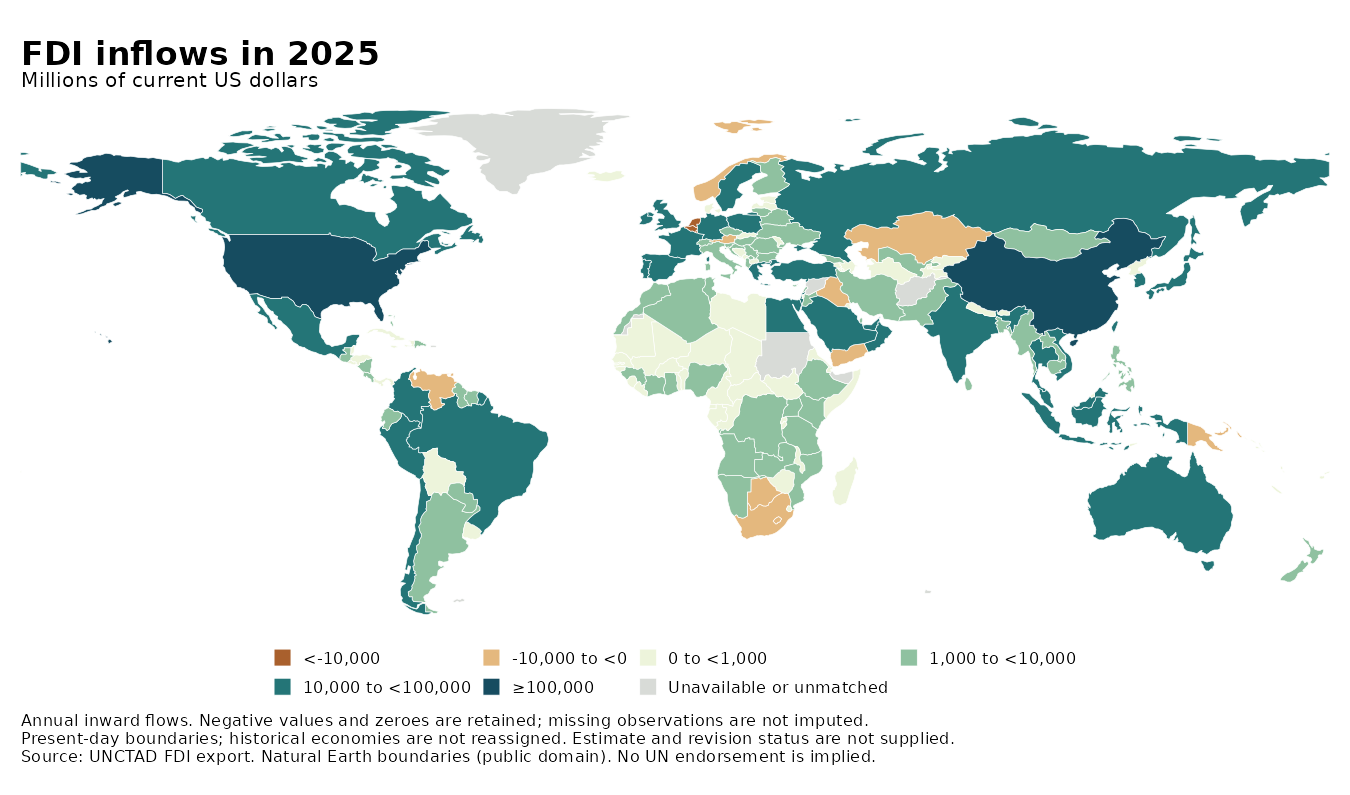
FDI inflows over time
Explore annual inward flows from 1990 to 2025. Play the timeline and select a country to see its trend.
UNCTAD export, USD millions, CC BY 3.0 IGO. Negative, zero, and missing values remain distinct. Present-day boundaries. Preview shows 2025; no UN endorsement is implied.
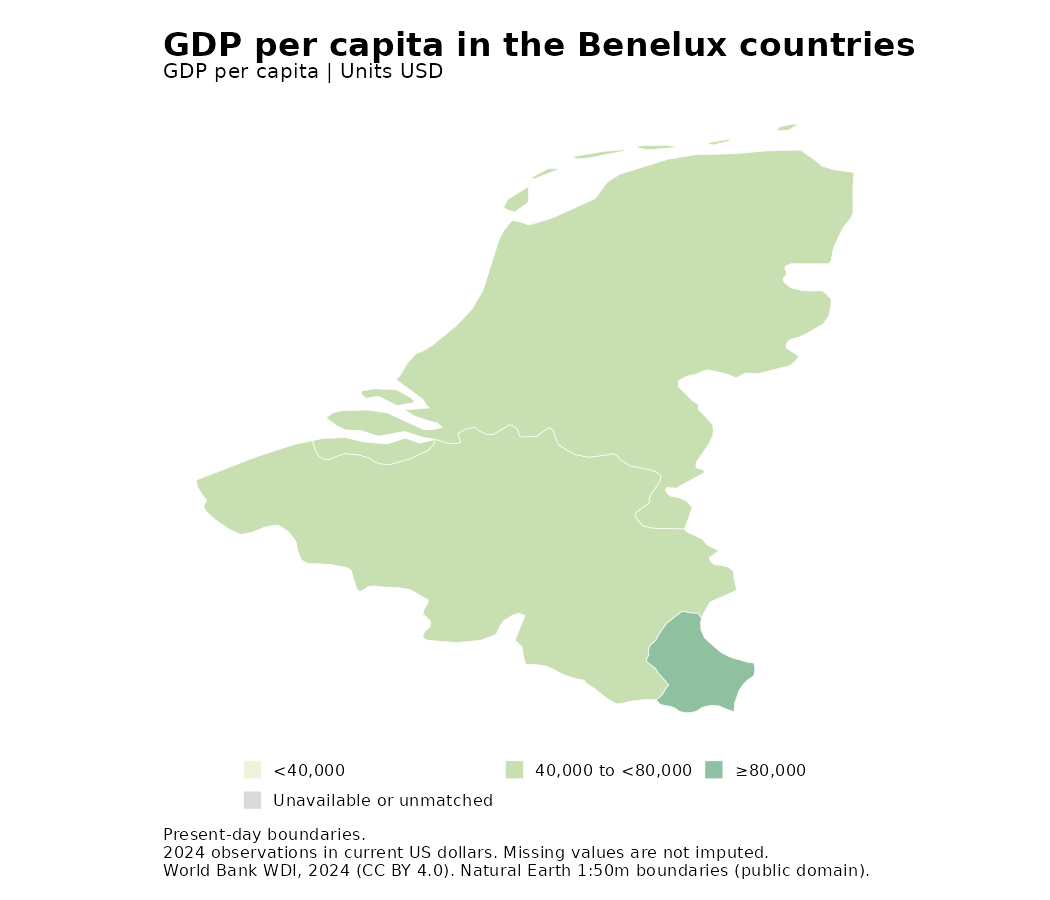
A regional sf map
Map GDP per capita in Belgium, the Netherlands, and Luxembourg using sf boundaries and automatic regional framing.
World Bank WDI, 2024, CC BY 4.0; Natural Earth boundaries, public domain. Demonstrates the compact presentation preset.
Networks and relationships
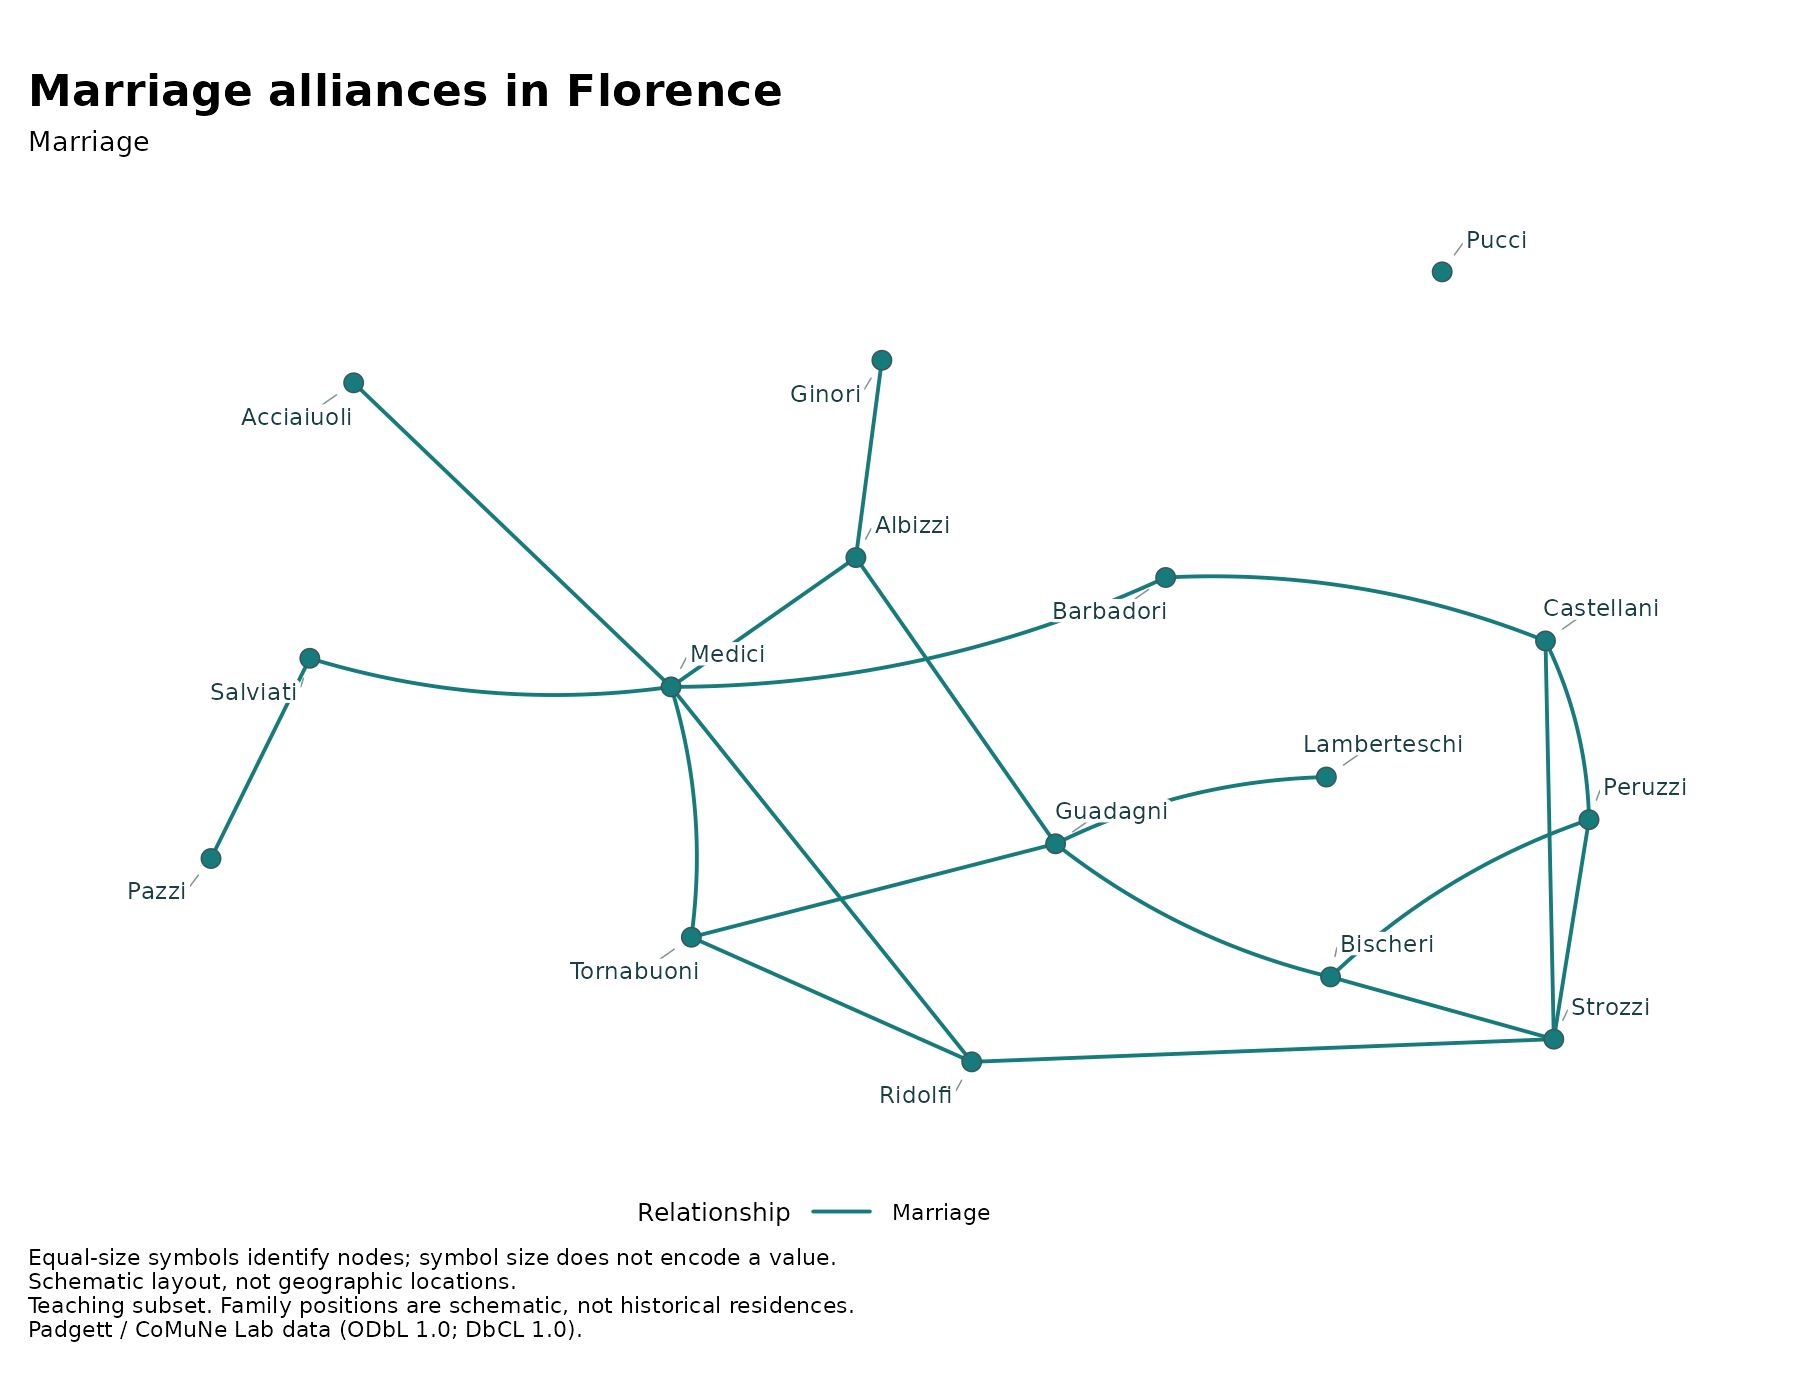
Florence family relationships
Explore marriage alliances and business ties among 16 families. Select a family or switch relationship layers in the illustrated viewer.
Padgett / CoMuNe Lab teaching subset, ODbL 1.0 and DbCL 1.0. Positions are schematic, not historical residences. Preview shows marriage ties only.
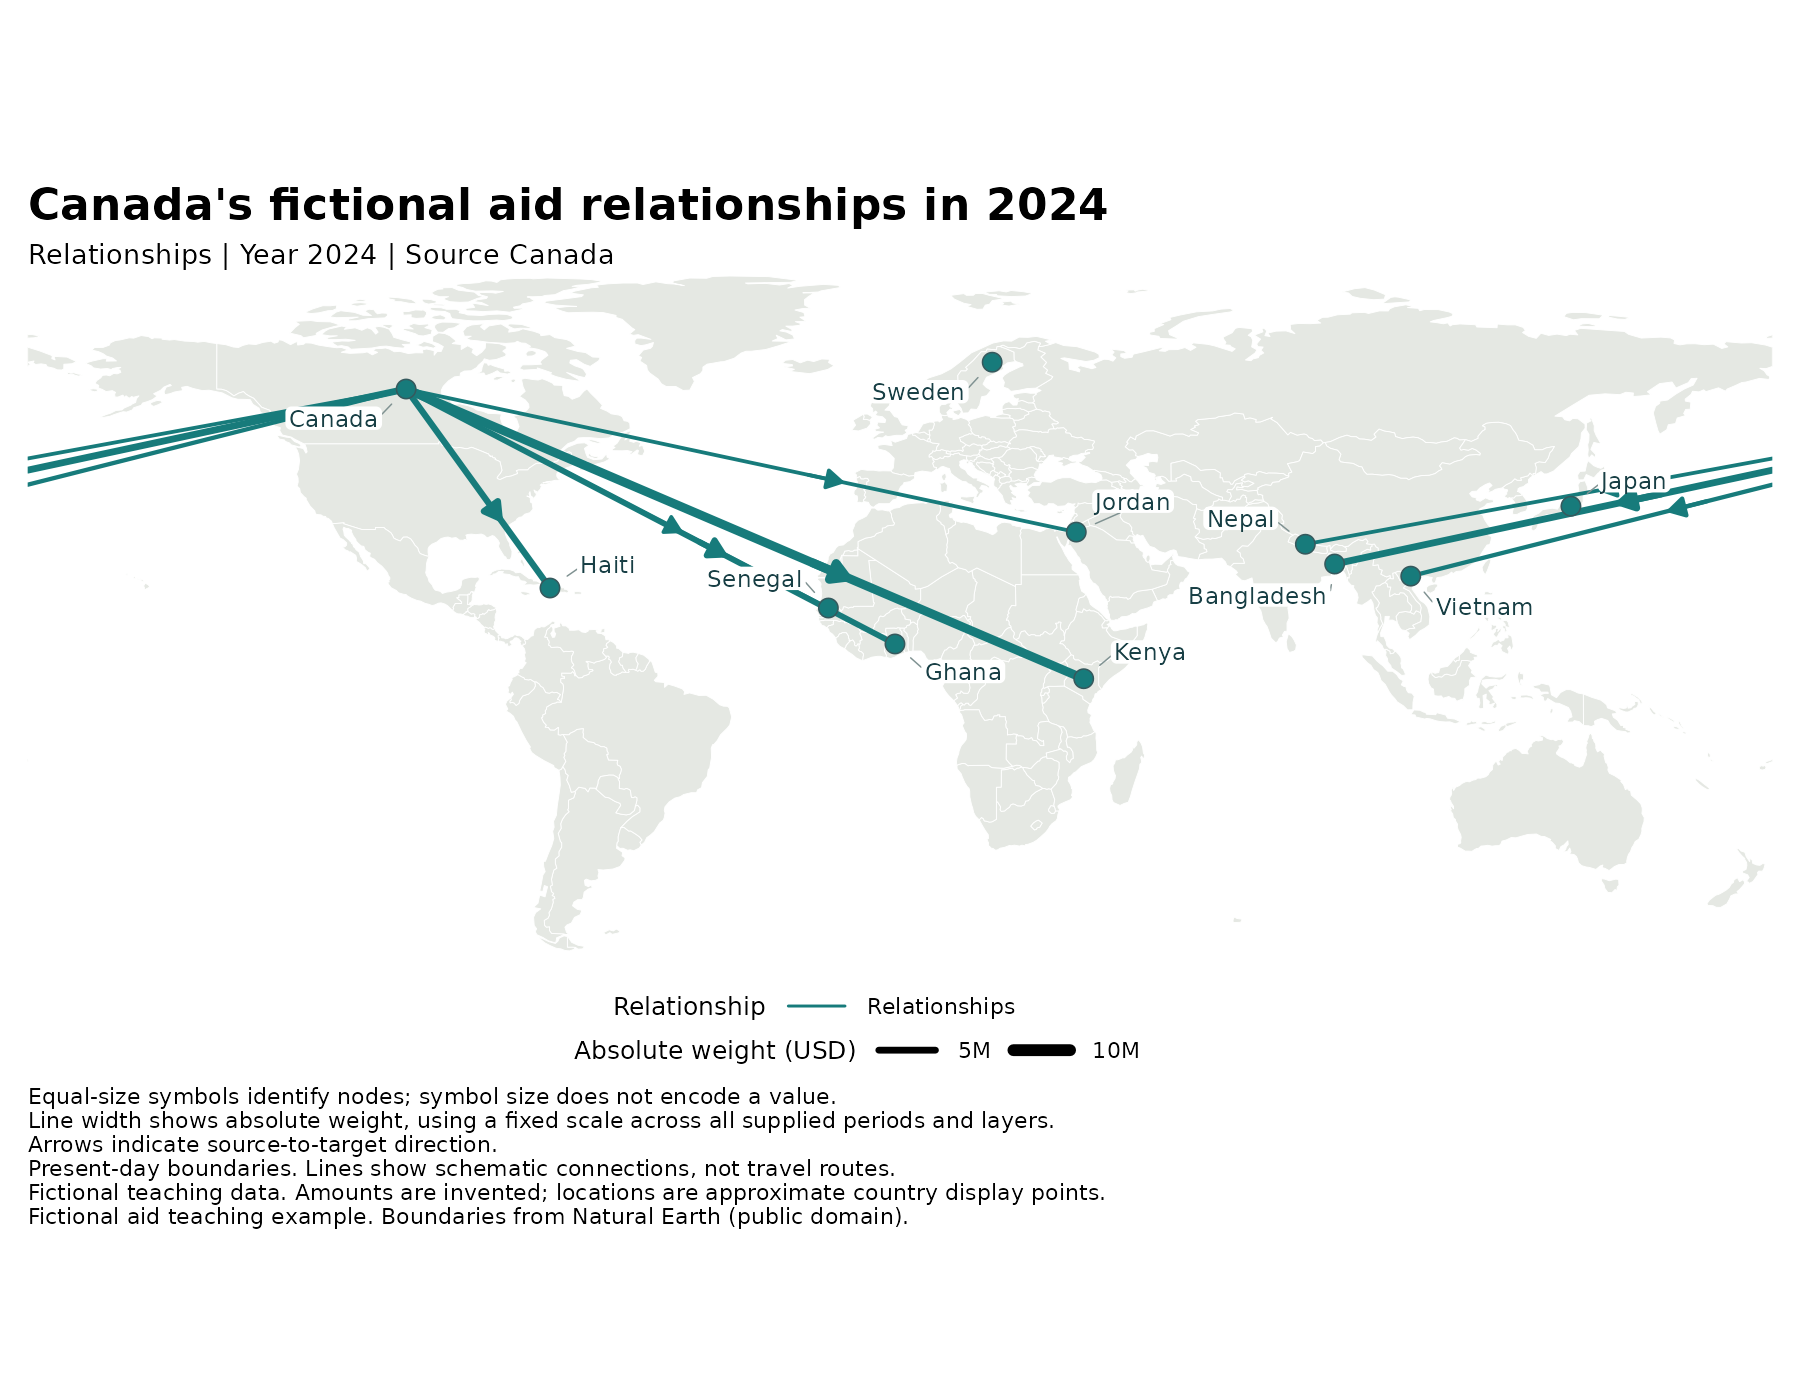
Fictional aid relationships
Switch donor and year to explore a directed geographic network with weighted flows, country selection, and filtering.
All aid amounts are invented for teaching. Locations are approximate country display points. Natural Earth boundaries, public domain. Preview shows Canada in 2024.
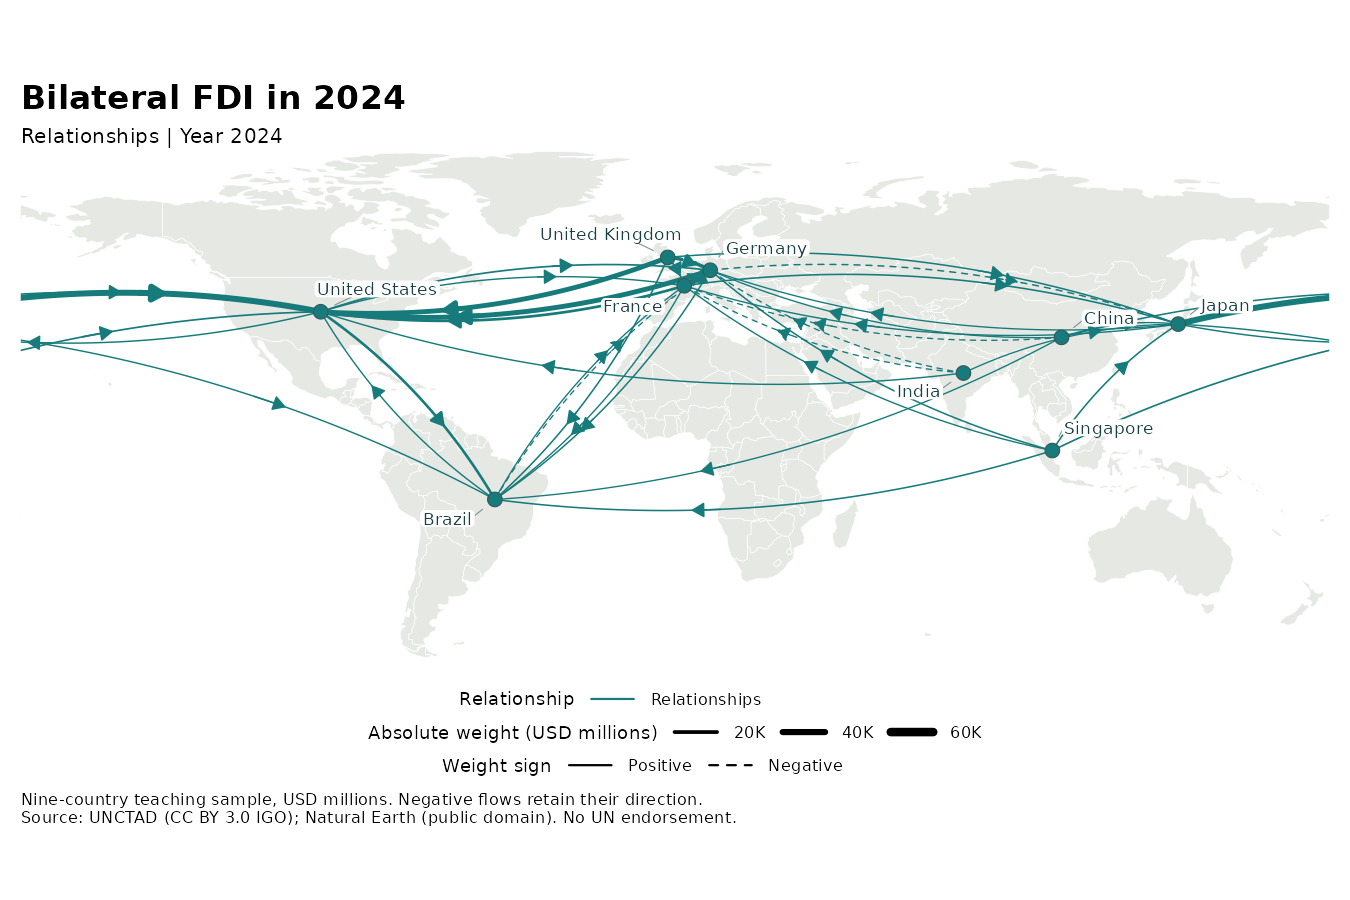
Bilateral FDI
Follow investor-to-host relationships in a nine-country sample from 2020 to 2024. Use the Europe inset to inspect clustered locations.
UNCTAD, CC BY 3.0 IGO. Reporting choices and mirror fallback are documented in the viewer. Totals cover this sample only; no UN endorsement is implied. Preview shows 2024.
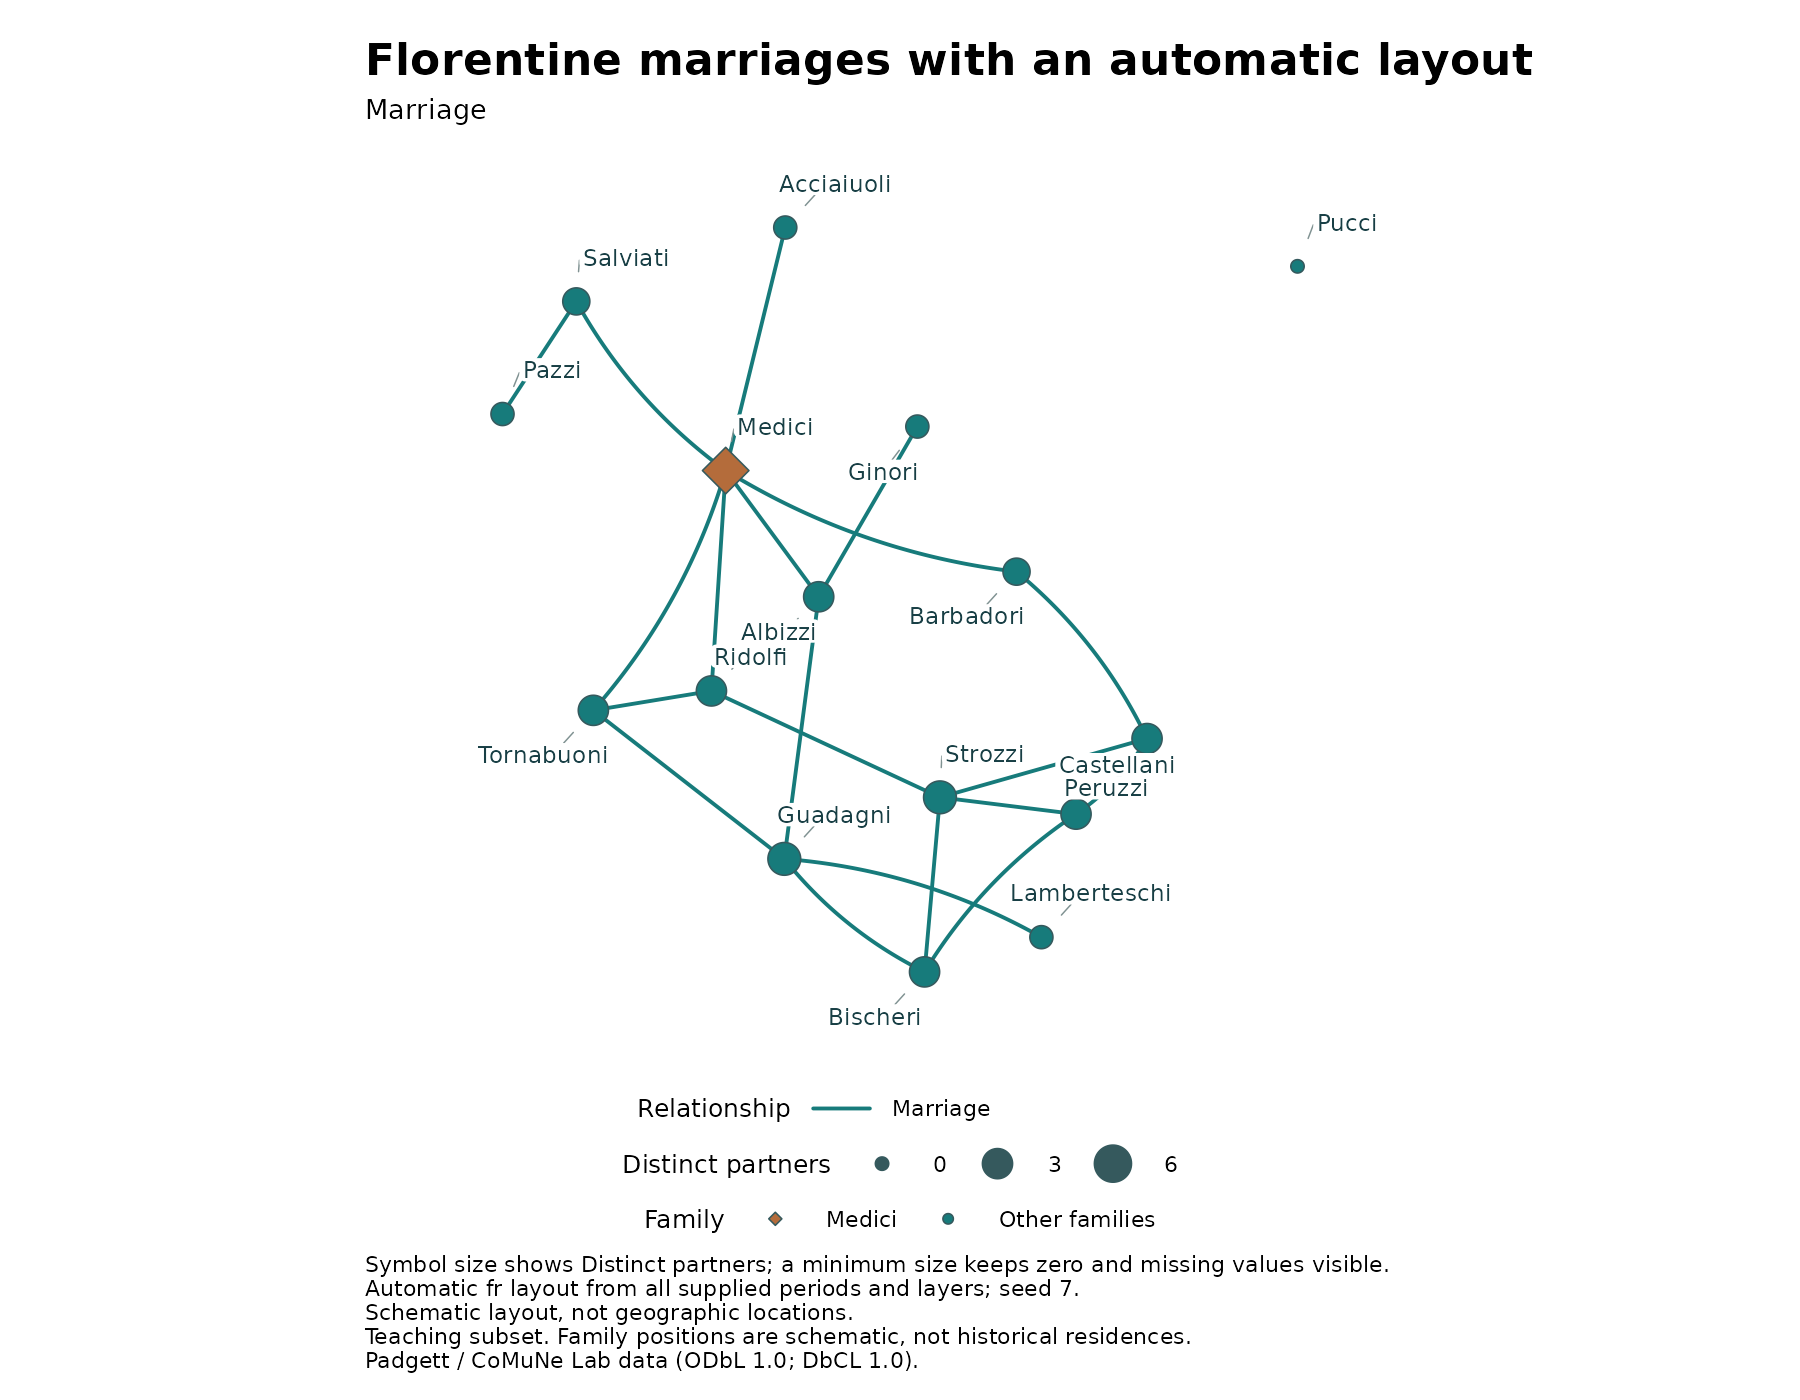
Automatic layouts and styled nodes
Arrange a schematic network automatically. The R script also makes ggplot2 figures with repelled labels and node size, fill, and shape mappings.
The preview sizes nodes by degree and highlights the Medici with an explicit display category. These node styles apply to the static figure. The HTML uses a precomputed layout of all ties and its own viewer styling.
Run an example yourself
Install offlineatlas, then run an example script in a dedicated output folder. The scripts use bundled data and replace their previous example exports.
library(offlineatlas)
dir.create("atlas-examples", showWarnings = FALSE)
setwd("atlas-examples")
source(system.file("examples", "gdp.R", package = "offlineatlas"))
browseURL("world-bank-gdp.html")
Each R code link above opens the complete script. The scripts are also installed with the package. For publication figures, see the static map script and static network script. Their PNG, PDF, and SVG outputs can be recreated locally. For example, compare the automatic network PNG with its vector PDF.
The tutorial explains how to adapt these examples. The function reference describes the available options.
A living example on the web
FDI Atlas is a related, more customized project. It shows how an atlas can become a public resource. For the standalone package exports, publishing can be as simple as putting the HTML file on a website. Everything embedded in that file is available to its viewers.
Full source notes and data reuse terms appear inside the exported viewers and in the package’s bundled notices. Downloaded demos retain those notices.